Champions League Draw Data: Pricing the League Phase
How an AI model would price Champions League league-phase paths using coefficients, form, squad strength, home advantage and travel.
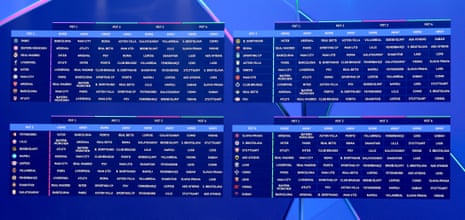
The 2026–27 Champions League draw is not simply a list of opponents. It is an eight-match schedule that must be translated into probabilities, expected points and qualification routes. In the new 36-team league phase, every club faces two teams from each of four pots, with four home matches and four away matches. A model such as the one used in the ScorePoint AI analysis lens would price each fixture first, then simulate the entire table thousands of times.
How the Champions League Draw Works
The format creates a single ranking from 1 to 36 rather than eight four-team groups. The top eight qualify directly for the round of 16. Teams finishing 9th to 16th enter the knockout play-off round as seeded sides, while positions 17 to 24 also reach that play-off as unseeded teams. The bottom 12 are eliminated.
That structure changes the meaning of a draw. A club does not need to win every difficult match, but it must avoid a schedule that produces too many low-probability away fixtures. The model therefore measures more than a team’s average strength. It estimates the distribution of possible points across all eight opponents and identifies whether a club’s likely finish is concentrated around 7th, 12th or 20th.
Turning Pots Into Probabilities
The first input is long-term strength. UEFA coefficient position is useful because it captures European performance across multiple seasons and helps determine pot placement. The projected 2026–27 structure places Arsenal, Manchester City, Liverpool, Real Madrid, Barcelona and Atlético Madrid in Pot 1, alongside holders Paris Saint-Germain, Bayern Munich and Inter Milan. Arsenal’s move ahead of Borussia Dortmund on the coefficient list is a clear example of how seeding can alter the difficulty of a club’s schedule.
Coefficient strength cannot be used as a final rating, however. It is a prior, not a complete forecast. A model would combine it with opponent-adjusted domestic and European form, controlling for the quality of the teams faced. A 3-0 win against a bottom-ranked domestic side should move the rating less than a 2-1 away victory against a top-four rival. The same principle applies to poor results: losing to a leading opponent is less damaging than dropping points against a lower-rated team.
Squad quality adds a forward-looking layer. The model would assess the depth and expected contribution of the available squad, rather than relying only on last season’s results. That matters particularly after the 2026 World Cup, when player workload and rotation could materially change match-level performance. The public draw information does not provide confirmed line-ups, injury lists or player availability, so those variables should remain adjustable rather than being presented as settled facts.
Home Advantage And Travel
Home advantage is not a fixed goal bonus applied identically to all eight fixtures. It should vary by venue, opponent and match context. A model would estimate how much a club’s home performance improves its win probability, then apply a smaller or negative adjustment when that same club travels to a difficult stadium.
Travel also matters, although it should be treated carefully. Distance, time-zone disruption, recovery days and the sequence of home and away matches can affect preparation. Four away games spread across the schedule may be manageable; four long trips packed into a short period may reduce expected performance. The travel component should therefore enter the match rating as a modest adjustment, not as a decisive explanation for every result.
Draw constraints must be encoded before simulation. Clubs cannot face a team from the same country, and the league-phase rules limit teams from playing more than two opponents from the same association. These restrictions mean the mathematically hardest possible schedule is not always a legal one. That is why a proper draw analysis must simulate only valid schedules rather than ranking opponents in isolation.
From Match Prices To Qualification
Once each fixture has a home-win, draw and away-win probability, the model converts those outcomes into expected points. It then simulates the full 36-team table, including goal-difference tie-break effects through a score-generation model. The useful outputs are not a single predicted position but a range: probability of finishing in the top eight, probability of reaching the top 24 and probability of elimination.
- Top-eight probability: the clearest measure of whether a club can avoid the knockout play-off round.
- Top-24 probability: the practical survival forecast under the league-phase format.
- Expected points: a schedule-adjusted estimate of total league-phase return.
- Draw difficulty: the difference between a club’s projected points and its projection under an average legal draw.
This framework also explains why Manchester United’s projected position in the pots has attracted attention: a lower seeding guarantees exposure to stronger opponents, even before the exact schedule is known. The correct analysis is not that a difficult draw makes qualification impossible. It is that the club’s probability distribution becomes wider, with fewer low-risk fixtures available to build a points floor.
Practical Champions League Outlook
The best draw preview will therefore separate reputation from schedule value. Paris Saint-Germain enter as defending champions, while Arsenal, Barcelona, Bayern Munich and Real Madrid are identified among the leading contenders, but elite status does not automatically produce a top-eight path. Venue balance, opponent-adjusted form and travel can move a club several expected points.
After the draw, the most useful question is not “Who got the hardest opponent?” It is “How many legal simulations produce a top-eight, top-24 or elimination outcome?” That is the central value of data-led Champions League analysis, and it provides a more practical forecast than treating the automated draw as a simple list of famous names. For further context, see the Champions League draw toughest paths analysis and the early-results signal-versus-noise analysis.
Research references
These sources were checked while preparing this ScorePoint AI analysis.